Collective Craving
An interactive Twitter visualization of human cravings during specific events. Collective Craving has collected almost one million tweets containing the keyword ‘craving’, captured on 13 major US public events and holidays from Fall 2015 to Spring 2016.
Live Demo: http://collectivecraving.us
Collective Craving has collected almost one million tweets containing the keyword ‘craving’, captured a day before, during, and a day after these major events: Thanksgiving, Christmas, New Year’s, the Super Bowl, the Lunar New Year, Mardi Gras, Valentine’s Day, the Oscars, Leap Year Day, St. Patrick’s Day, Easter, April Fool’s Day, and Mother’s Day. Using the Web as its main interface, it provides users with a macro-level comparison that shows the top 50 most craved foods during those events and how the popularity of a given food changes over time. It also lets users be immersed in a micro-level exploration of every event, within a specific time constraint.
This project is the final implementation of my thesis at MFA Design & Technology, Parsons. For more detailed process, see the making behind this project.
THE CHART
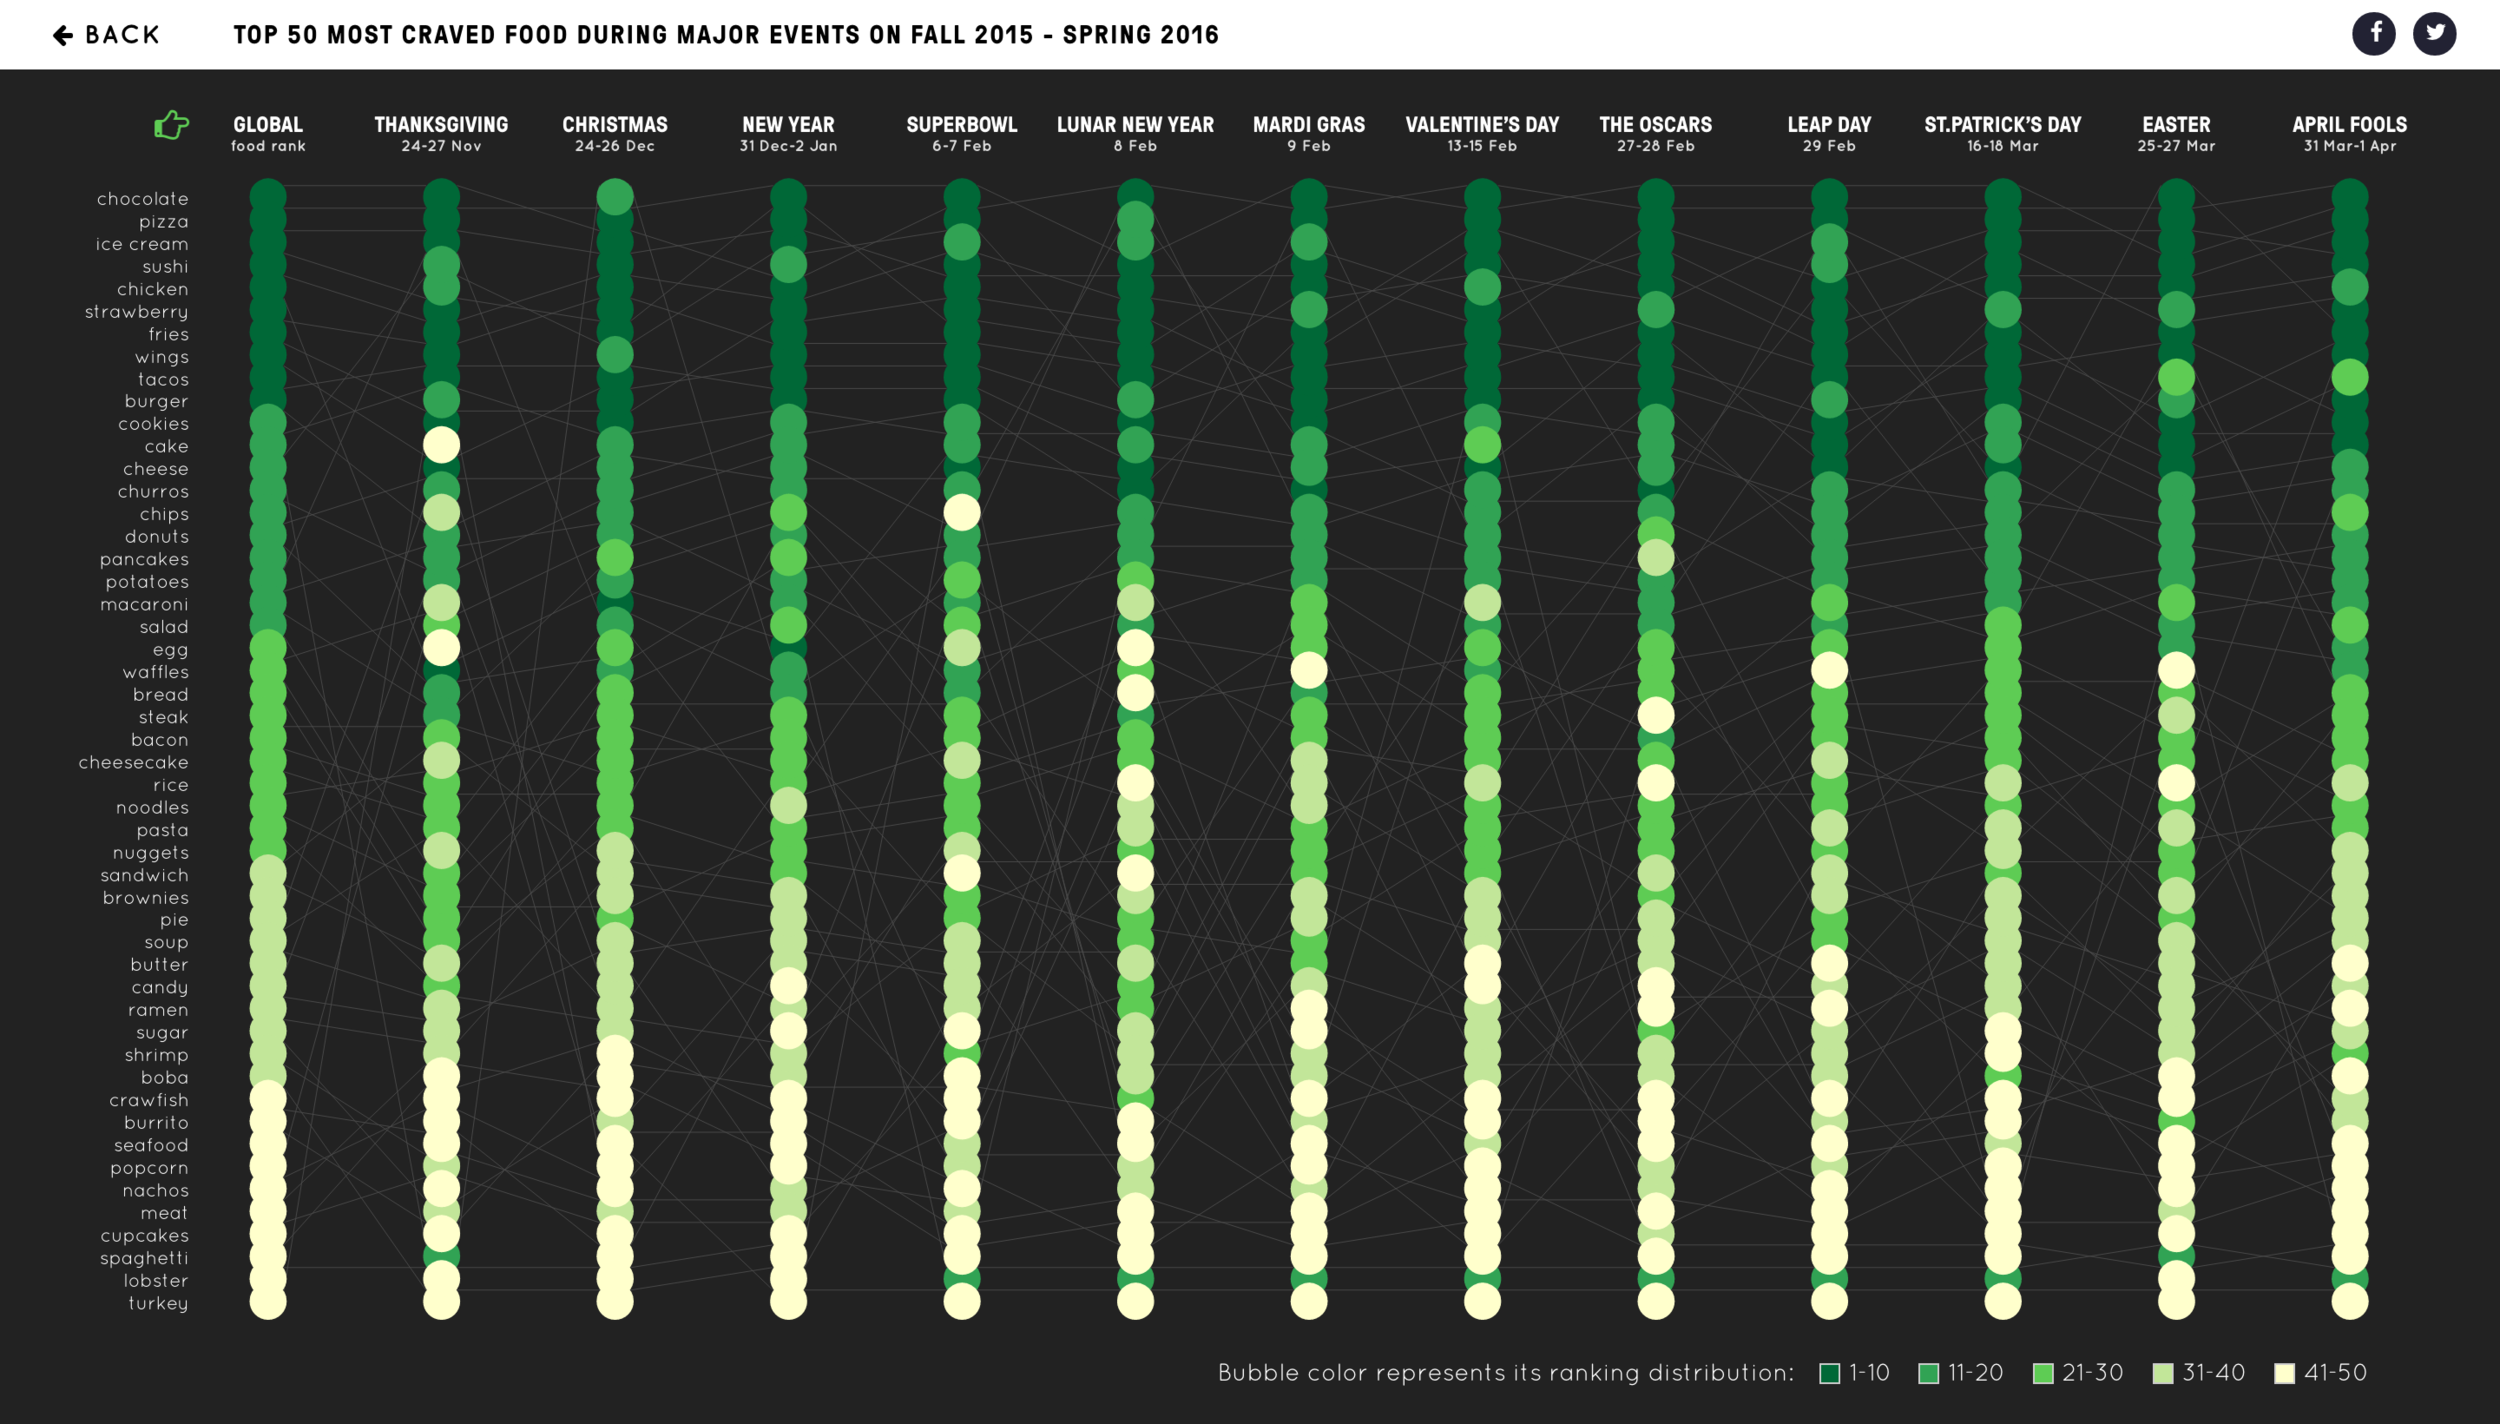
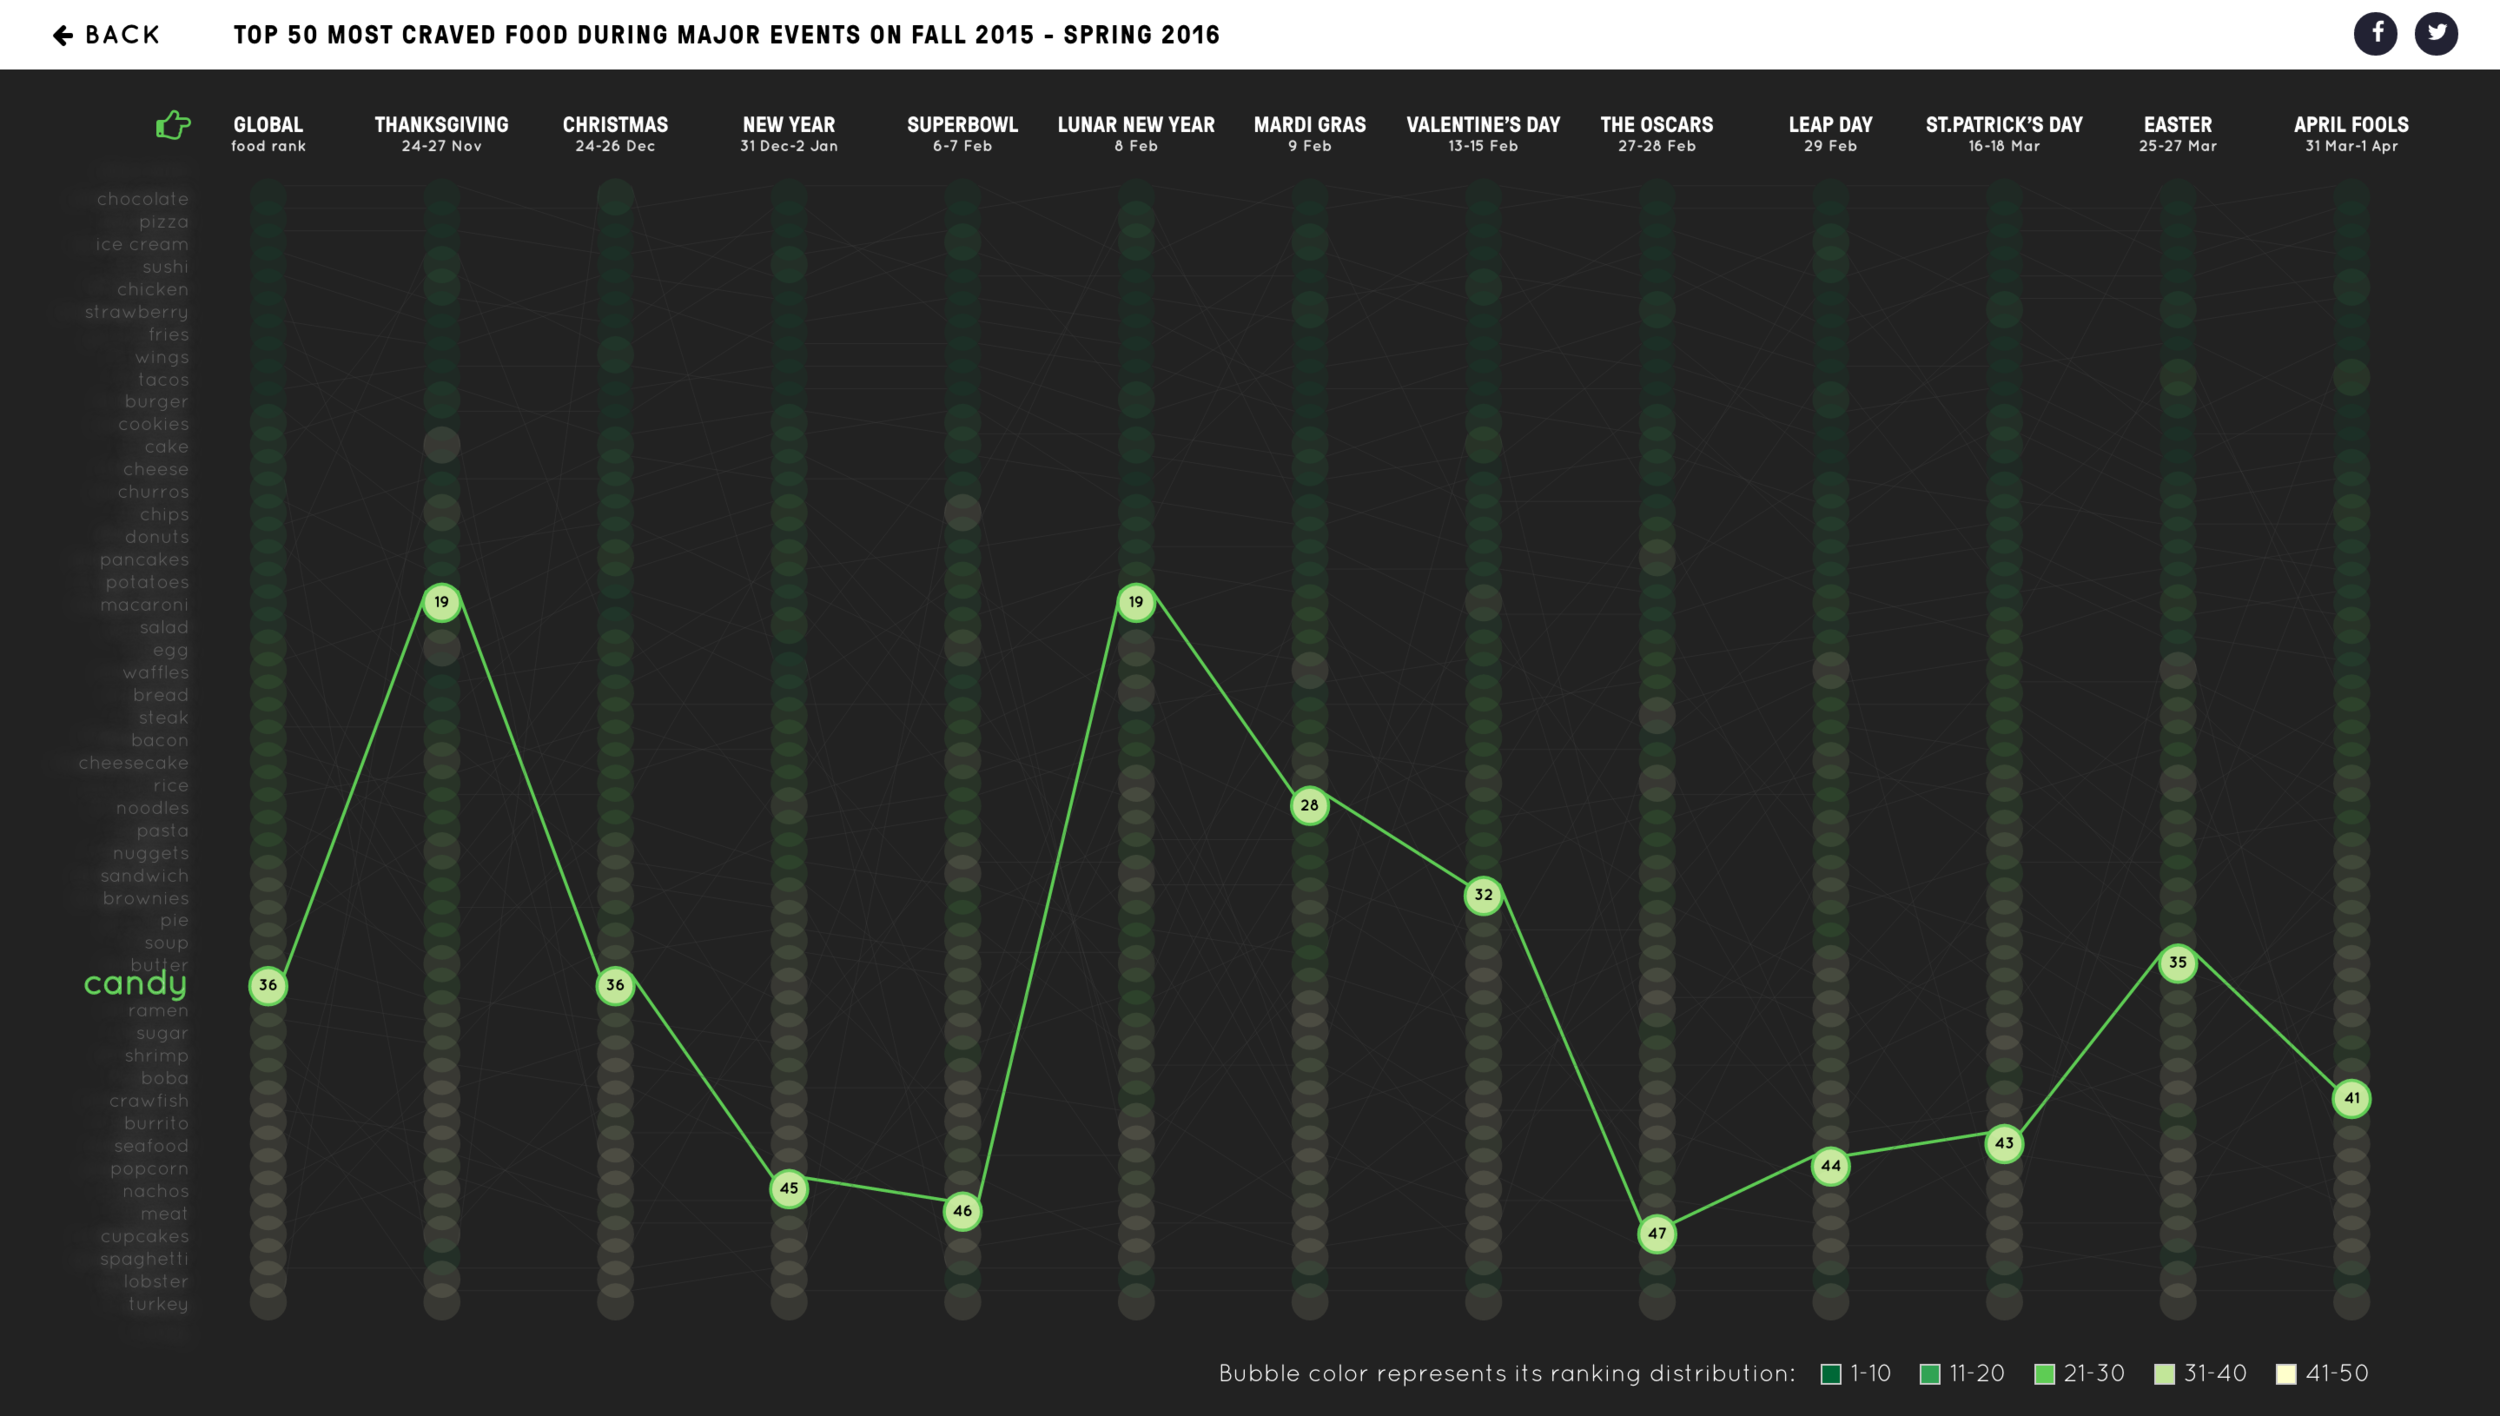
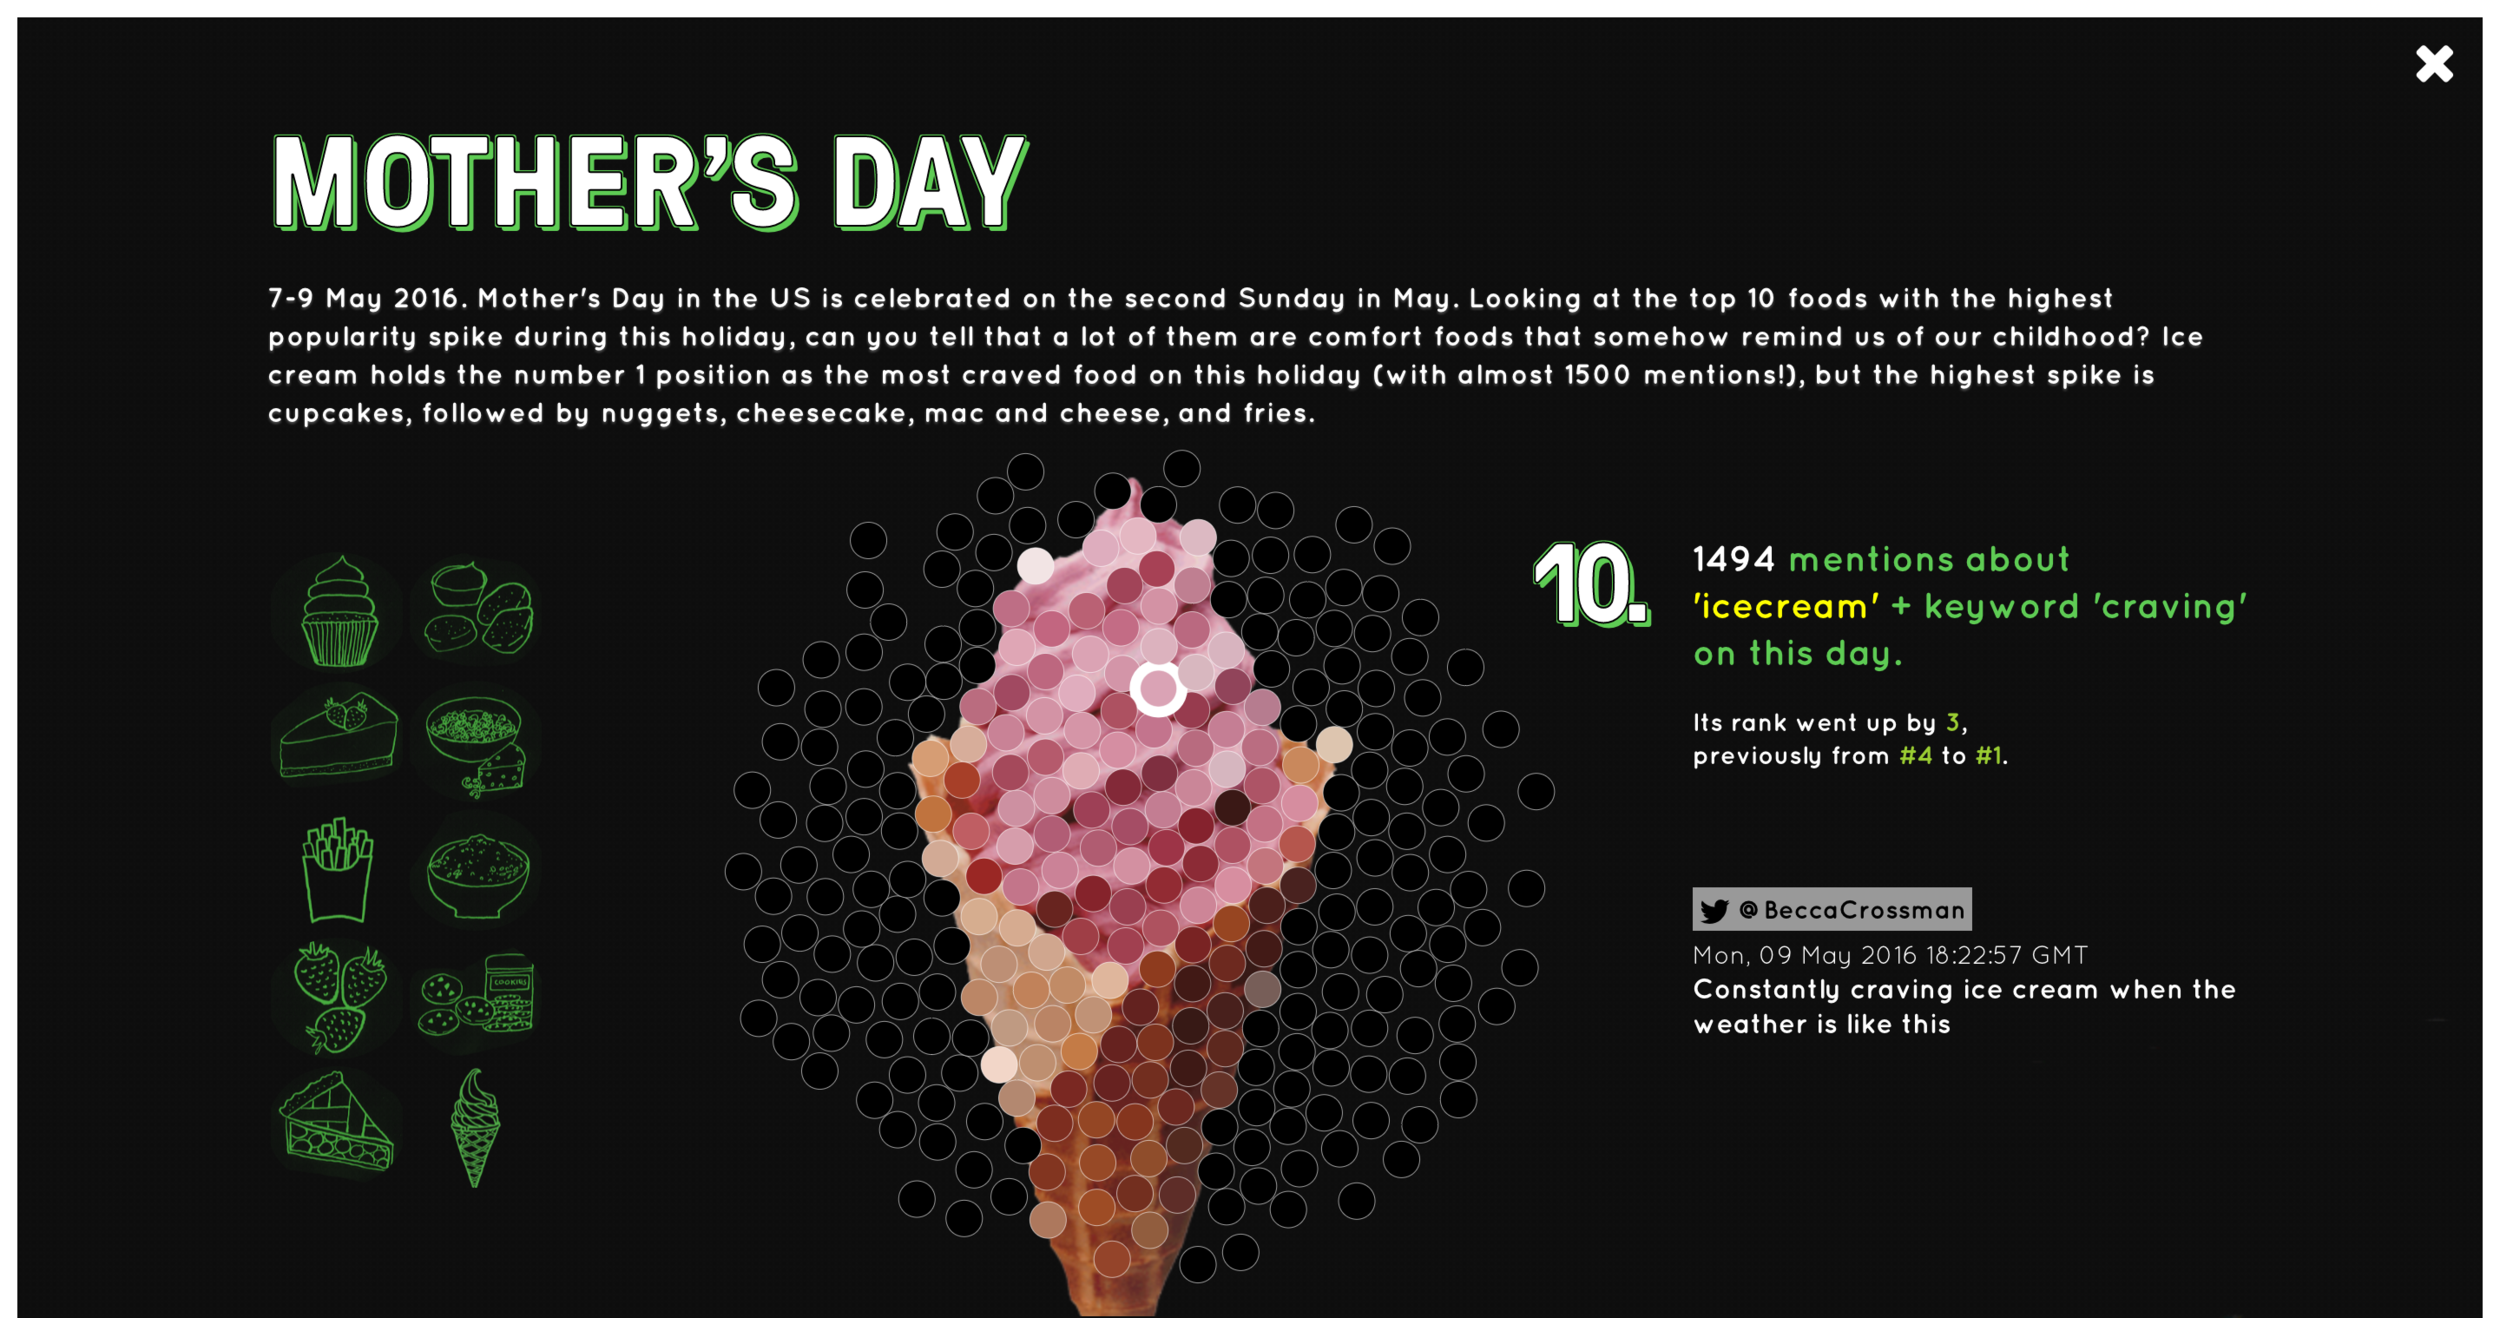
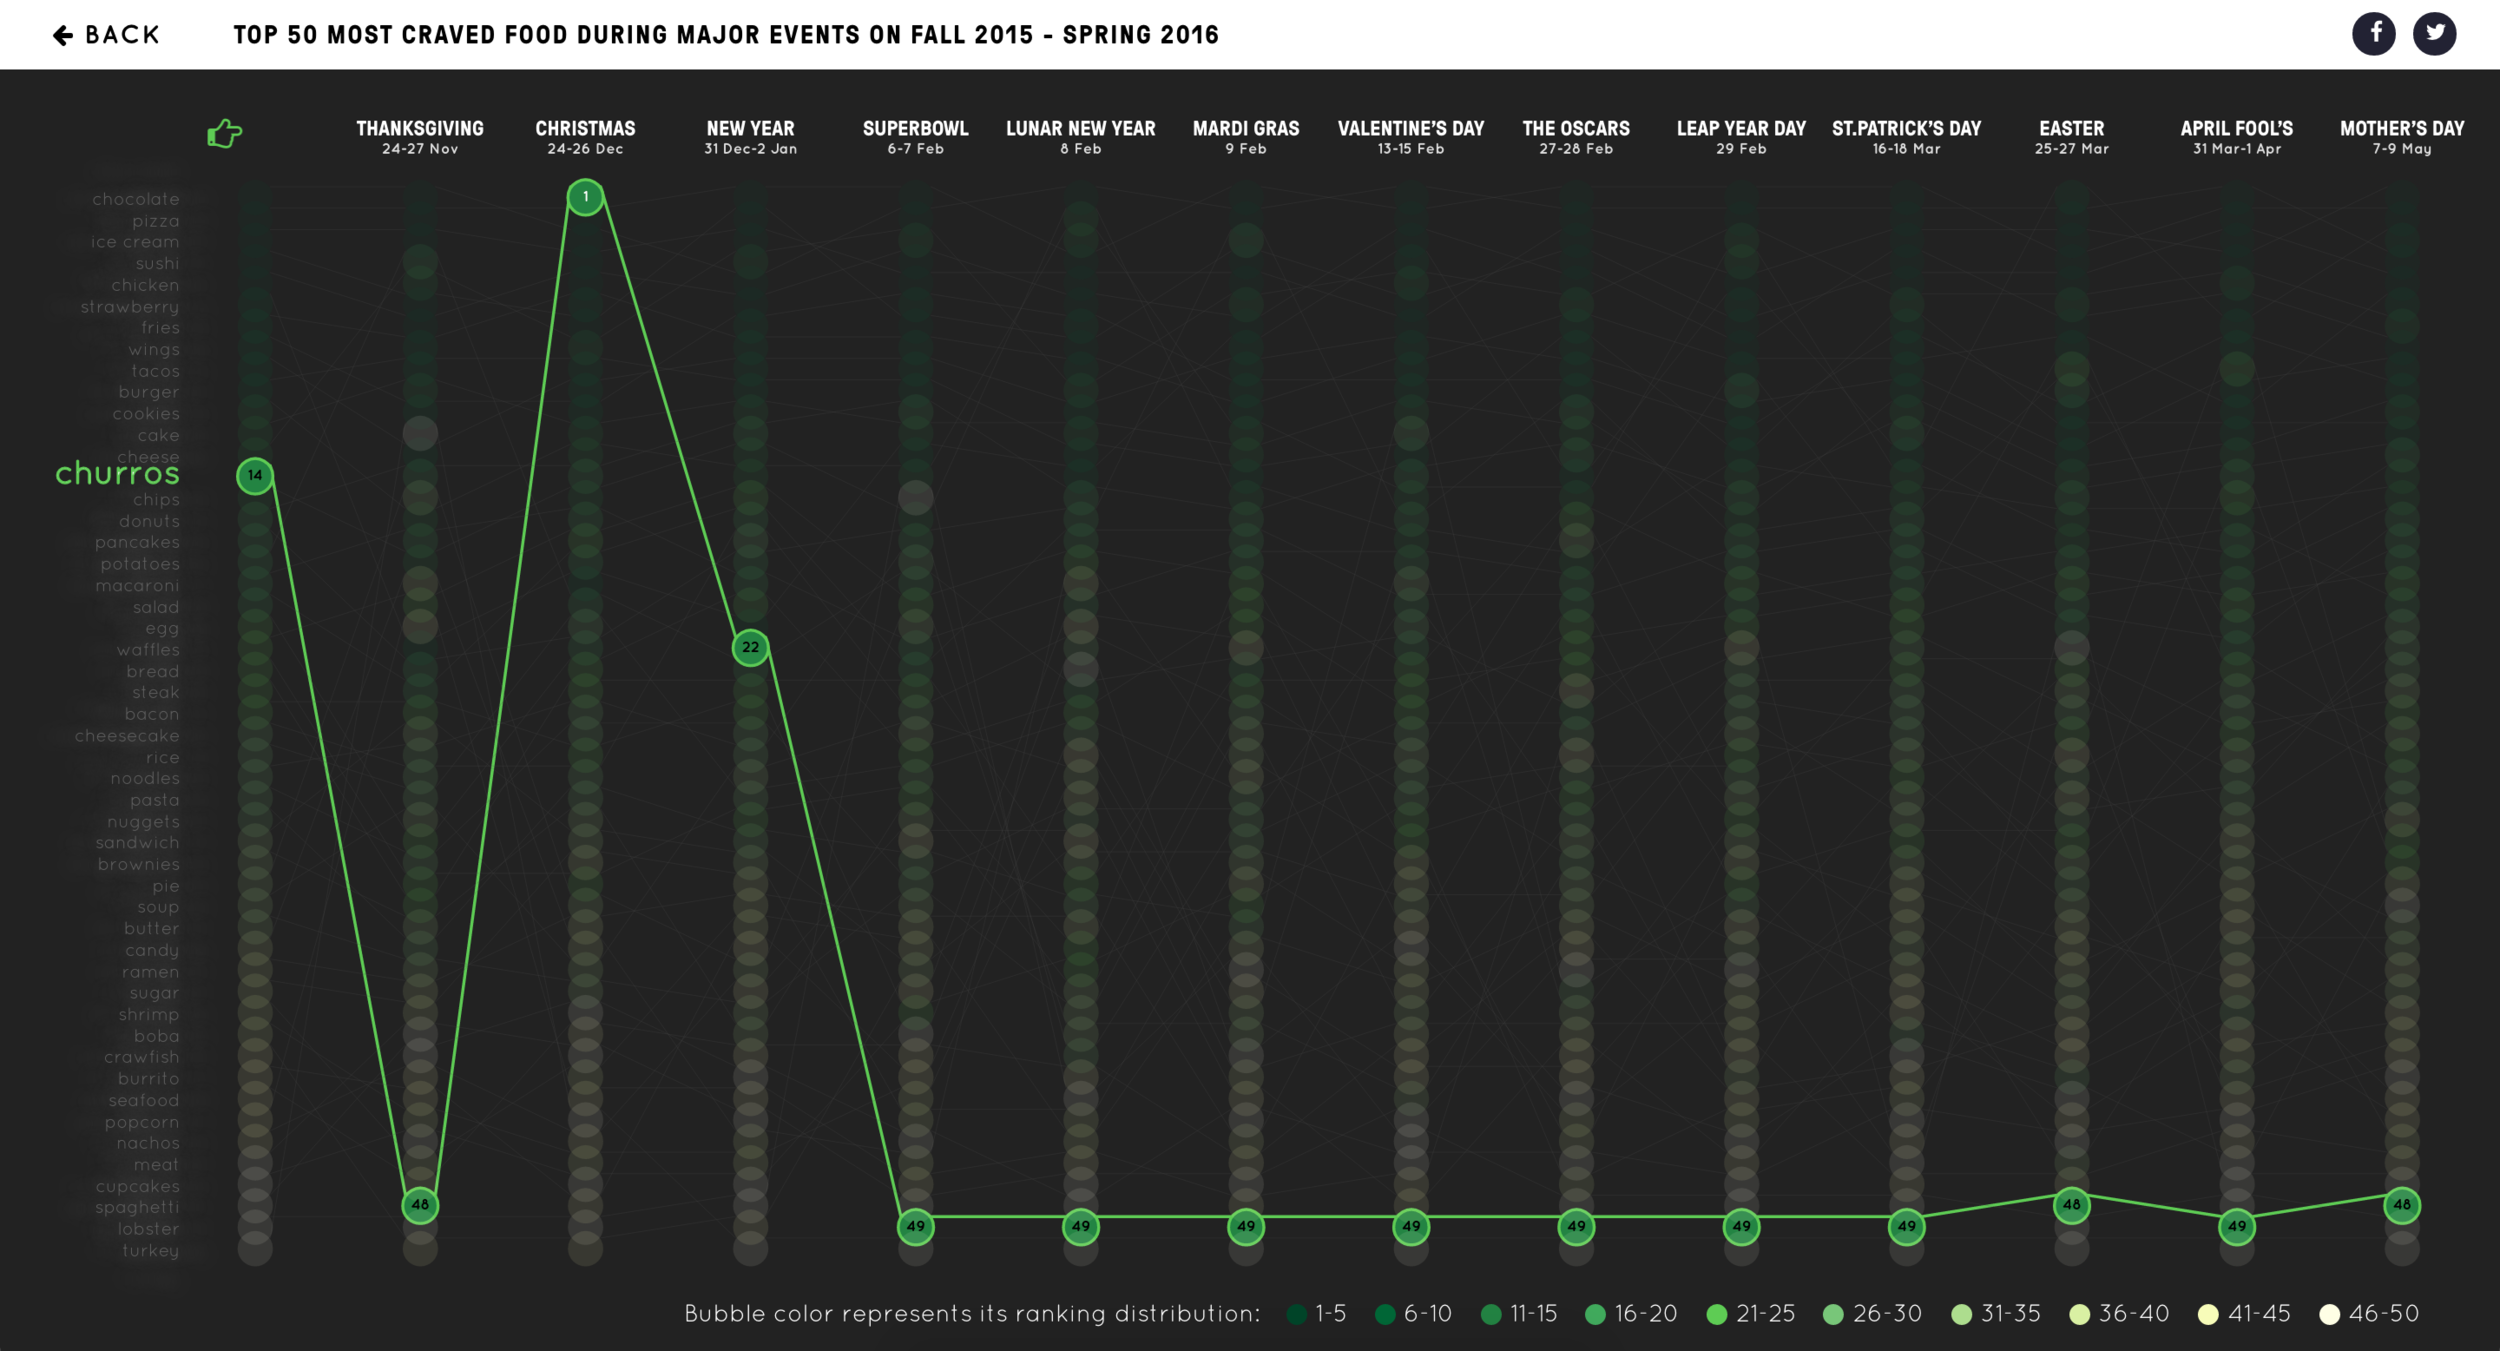
Using Bump Chart, I had the pleasure of looking at just how one food’s popularity stack up against each other and the driving forces behind it, correlated to each event. You can click on each event to see a more detailed breakdown containing tweets from the 10 food with the highest popularity spike, which brings you to a new playful interface in forms of wiggly bubbles that you can hover -- each bubble represent a tweet about particular food craving.
INSIGHTS
The intention at first was trying to be as objective as possible and not trying to imply causality that one thing causes another. But inevitably some things are quite self-explanatory in a way that users would see it as something obvious and expected.
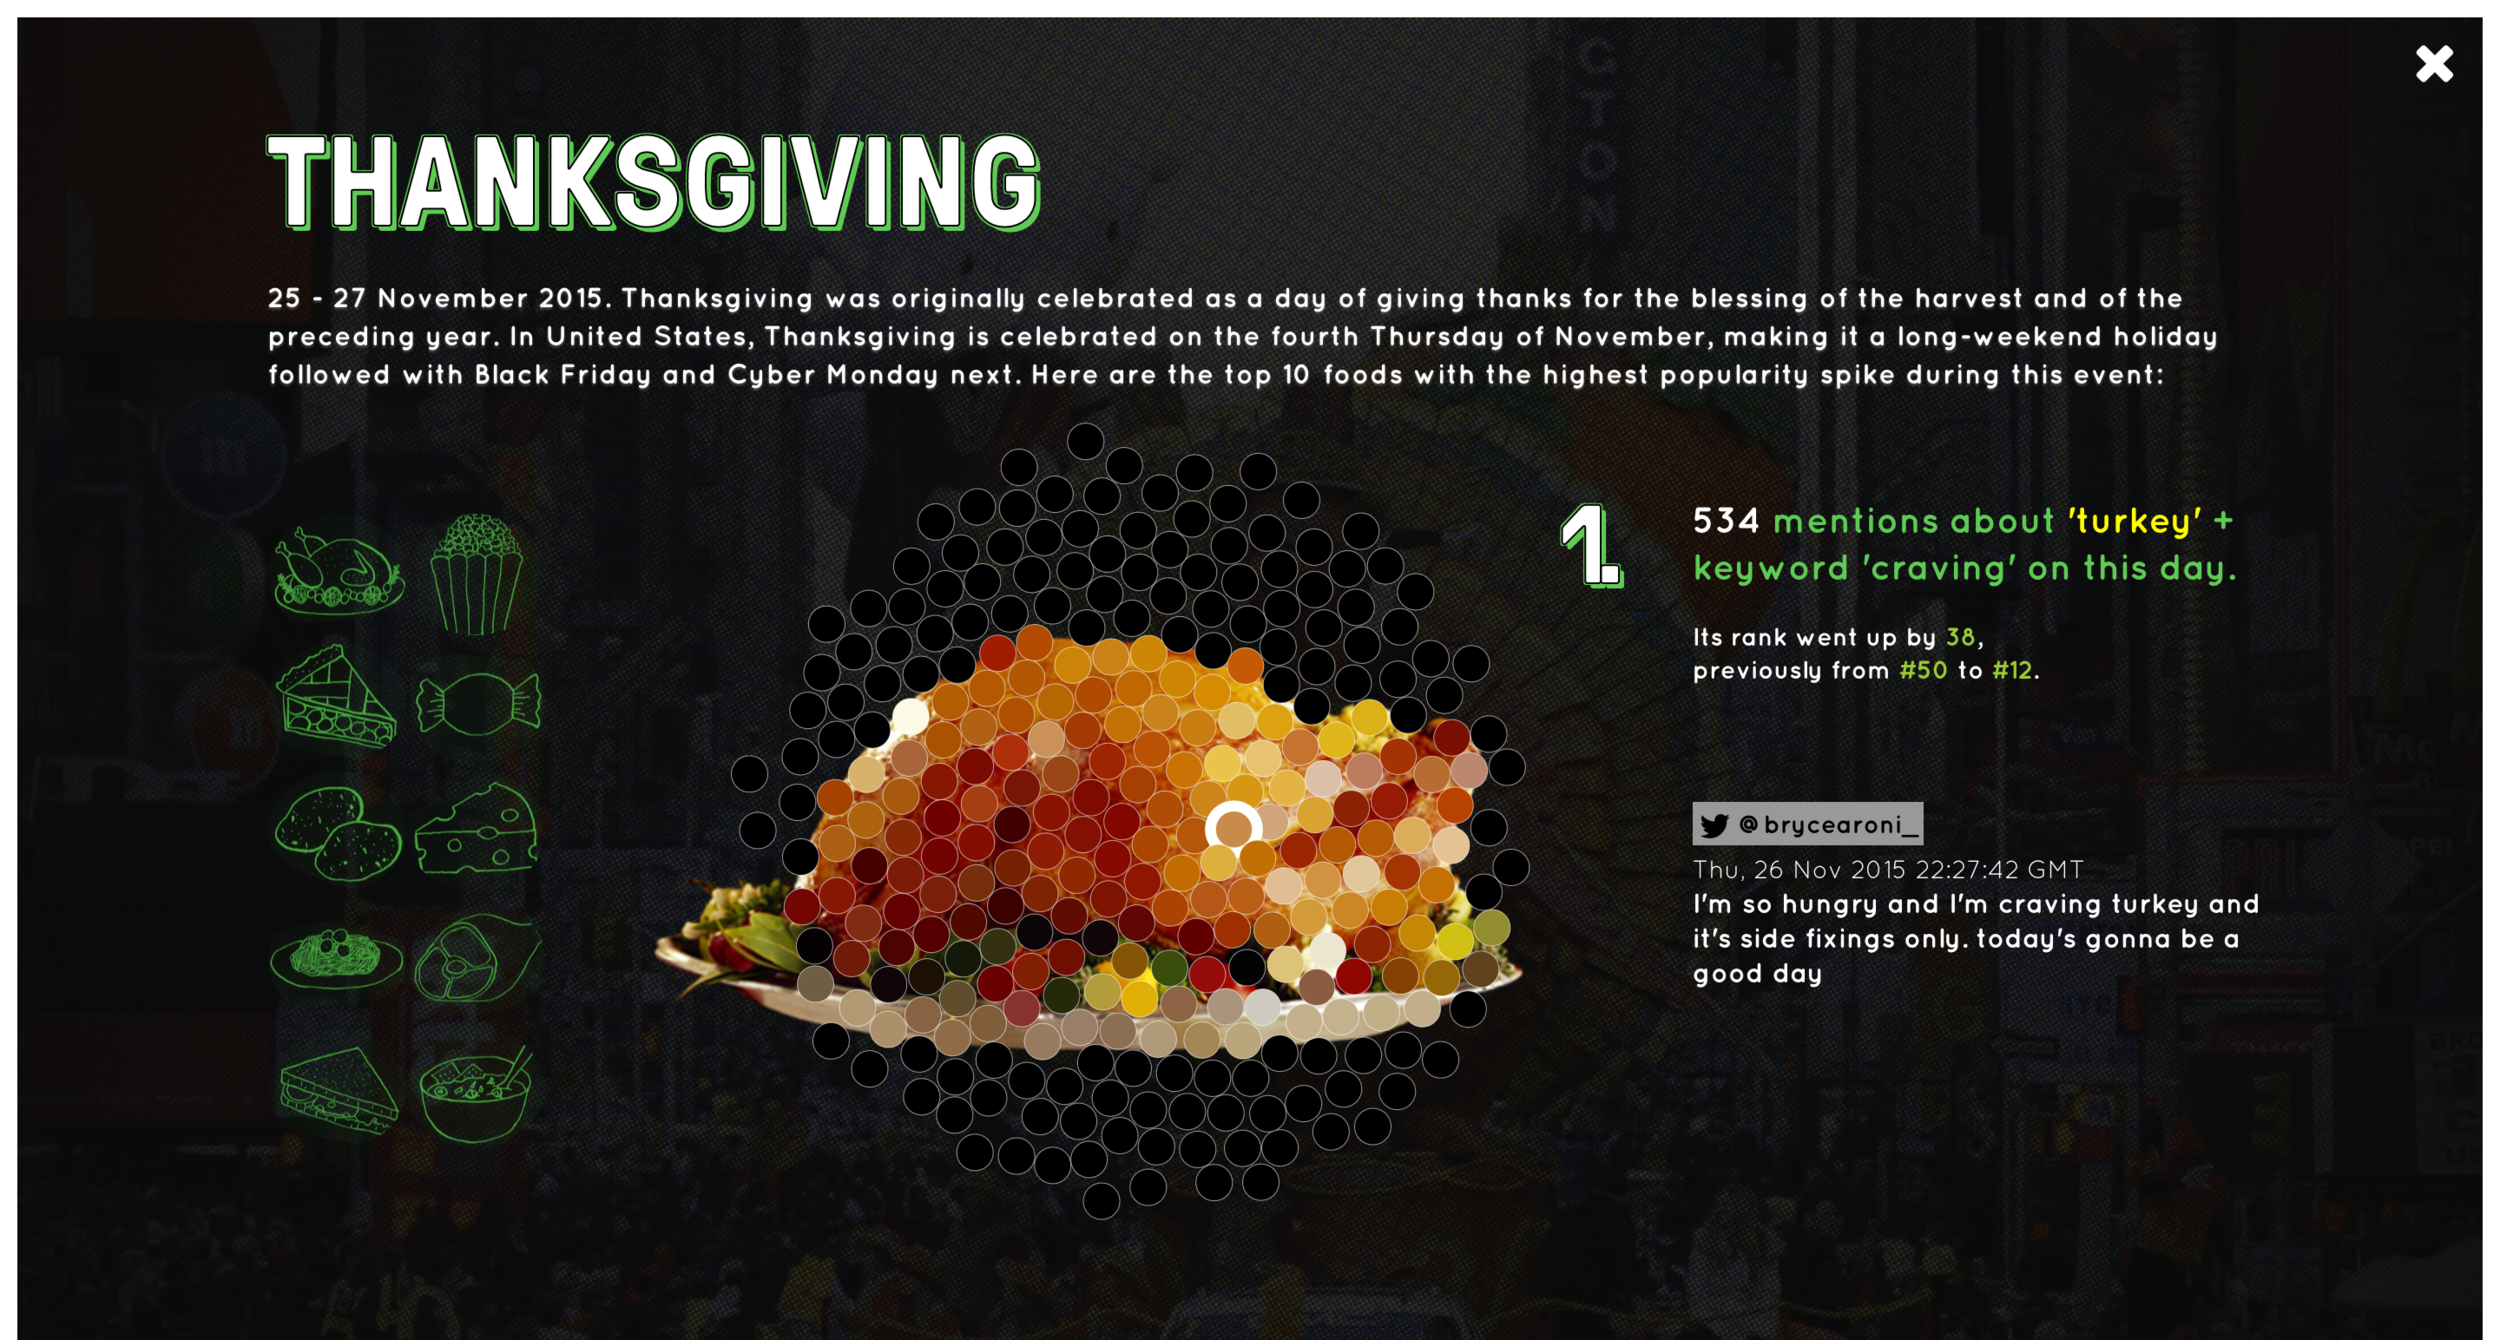
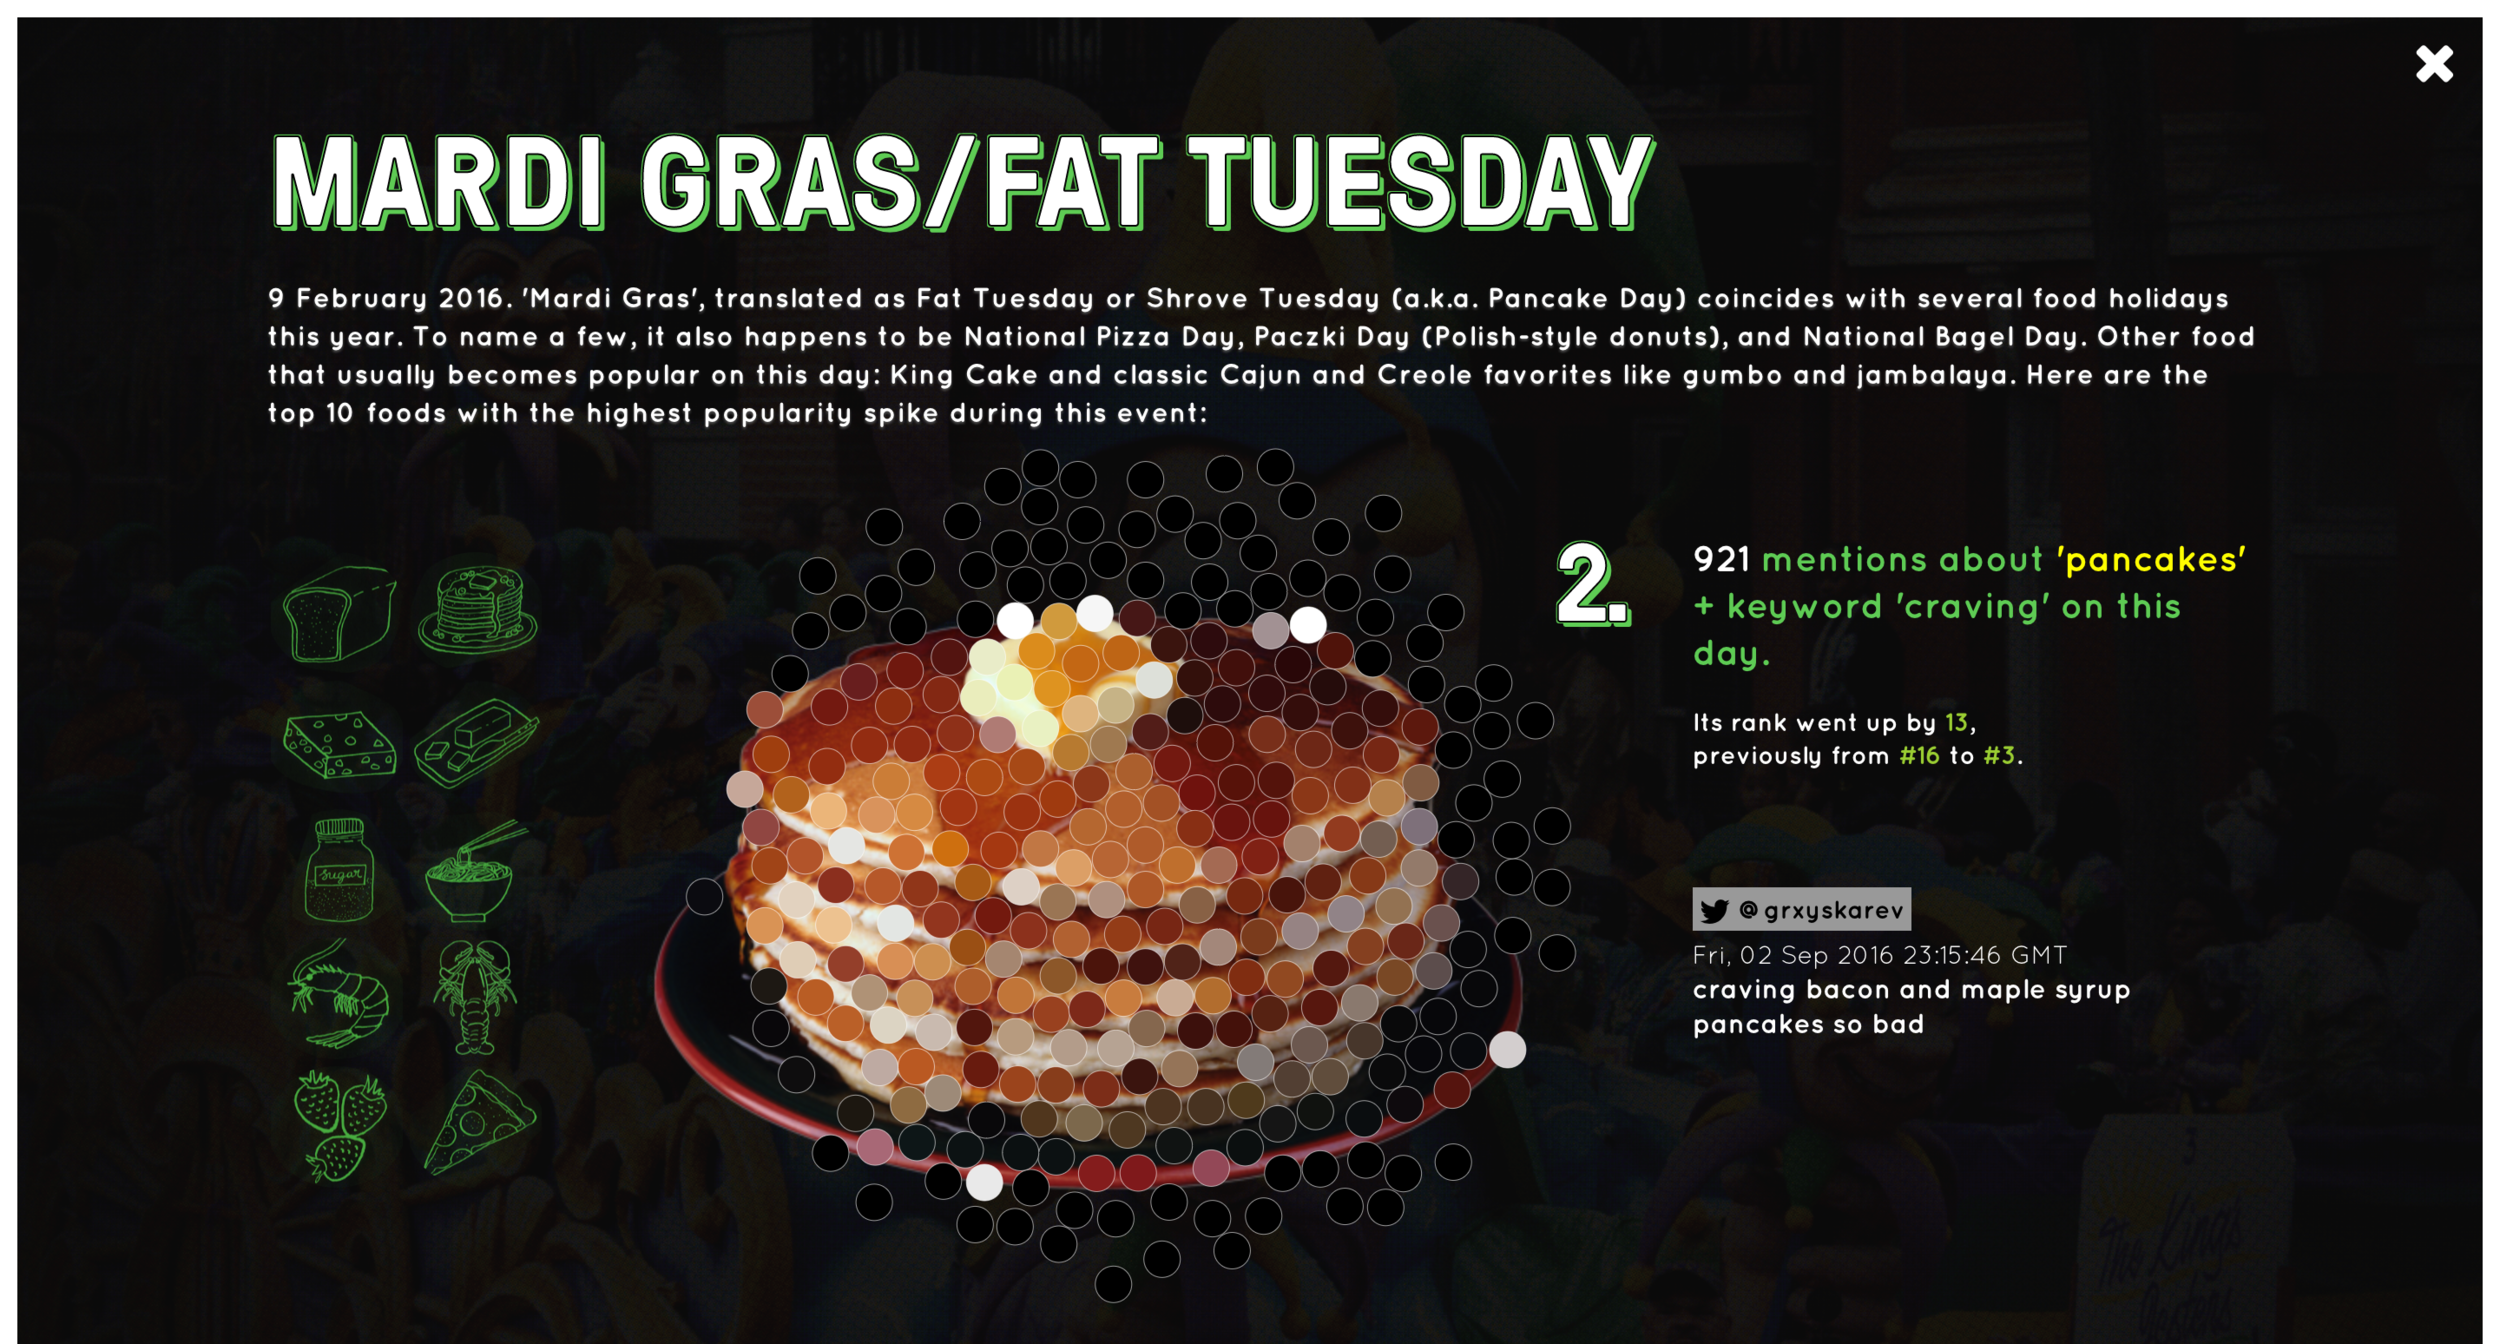
For example, pizza is generally always stable and never go lower than the fifth rank, globally. The only time it would drop its popularity was during the Lunar New Year and that’s probably expected since perhaps a lot of people were craving for more Eastern food than Western food on that day. Pizza was also popular during Mardi Gras, which also happened to coincide with National Pizza Day (and Fat Tuesday + Pancake Day!). And then there's Thanksgiving, the only time of the year where people are expected to crave for turkey:
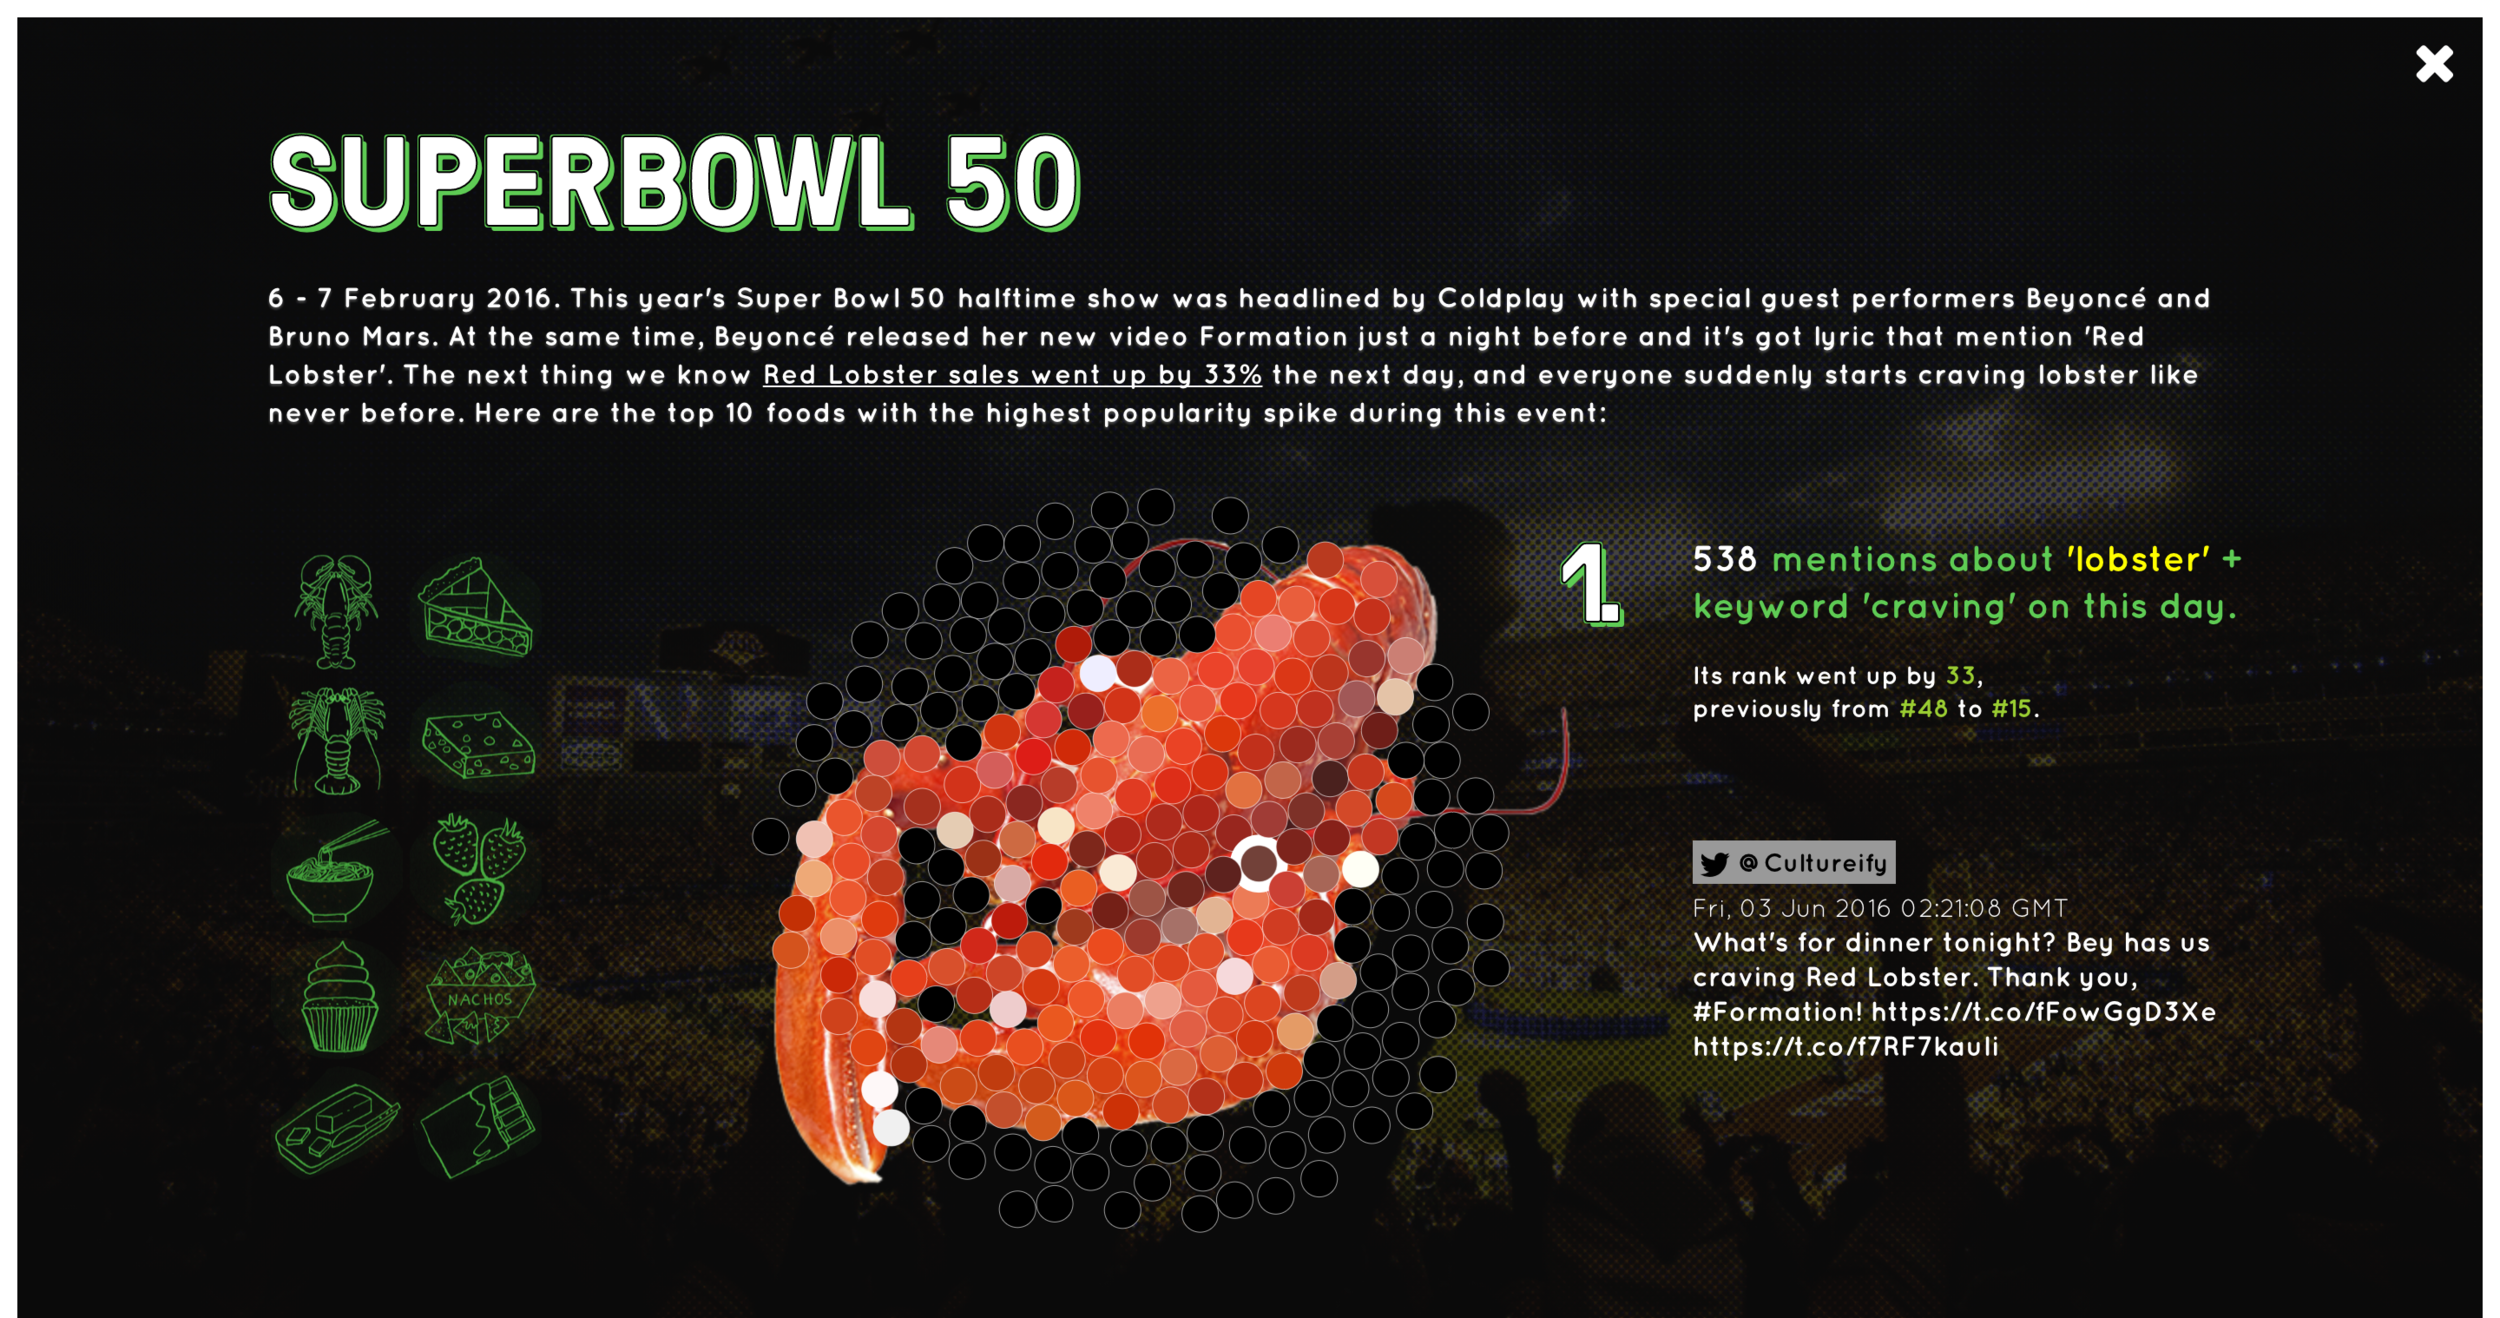
But then there were also some surprising turns. Super Bowl 50 is a great example. When traditionally most people would associate watching the event with party snacks like chicken wings and beer, this year’s Super Bowl was different (all thanks to Queen Bey!). Beyonce released her video ‘Formation’ on February 6th, 2016, one night before she performed the song at the Super Bowl halftime show. It is a powerful song that the TIME magazine mentioned as an activism for African Americans, women, and LGBTQ people8. What’s interesting is that somewhere along the lyric she intentionally stated “Red Lobster” and then suddenly the amount of people craving for lobster during this event is higher than ever. Compared to the previous event, its rank went up by 33, going from rank #48 to #15 (on a scale of Top 50 most craved food).
This is the perfect example of showing how a database of human cravings works as a passive observation tool and provides unexpected insights. In this case it strongly suggests that food trends can be highly driven by pop culture and celebrity endorsement.
CHALLENGE
One of my biggest concern is to handle non-retweeted tweets versus retweeted tweets properly. By default, this database saves every retweet as its own entry. Problem arises when a public figure tweeted something and it gets virally retweeted. There’s a possibility that the craving data now becomes skewed because when followers retweet their idol’s tweet, it doesn’t necessarily mean that they’re also craving it at that particular moment. It could be a form of adoration or fans loyalty, or perhaps they think it’s interesting enough to spread as news.
Take ‘churros’ on Christmas holiday for example. On December 26th, a Filipino actress Maine Mendoza with over 3.6 million followers tweeted:
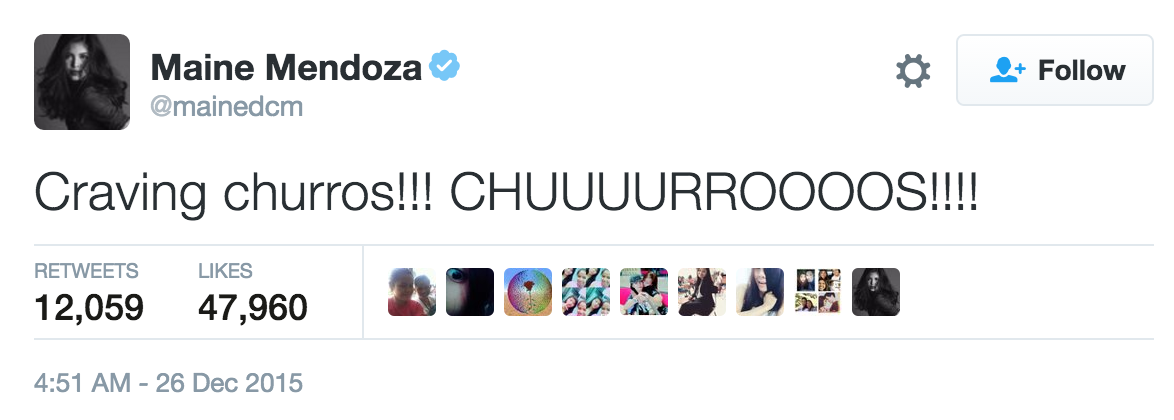
This gained almost 48K likes and got retweeted over 12,000 times, and around 8,000 ofthem were retweeted during the scraping period. The result was an ultra high spike for churros , which have always stayed consistent at lower ranks but suddenly becomes popular on a particular event because of just one public figure. This type of discovery is also very unexpected, but I think it doesn’t quite work as to depict the real craving hype on Christmas festivities.
CLOSING
At the core of this project lies an investigation into what kind of insight can we gain from the arbitrary, everyday data that we usually don’t care about, and how to turn it into a more meaningful knowledge. This project tries to capture the fleeting moment of human desire and cultivate the uniqueness of craving as something ephemeral and mutually experienced. By creating and analyzing the database of human cravings, this project aims to evoke interest in the socio-digital era through visualizing our food culture as depicted by online users.
This project was also featured in the Kantar Information Is Beautiful Awards 2016 Longlist.