Mapping, Tracking, and Recording for 72hrs Project
Next project after 7x7 from Sven is to map, track and record something for straight 72 hours and then process the data into some other form - it could be data visualization, web, audio, video, timelapse, program, etc. I decided to record myself, all of my activities: what I eat, what I drink, where do I go, what do I do, how long do I sleep, how many times I peed, and some other basic stuff. So here it goes, I made an interactive web timeline using Timeline.js and Isotope JS plugin to present the data from September 6th, 2014 09:00:00 AM to September 9th, 2014 09:00:00 AM.
Live demo: http://umisyam.us/playground/MTR72/

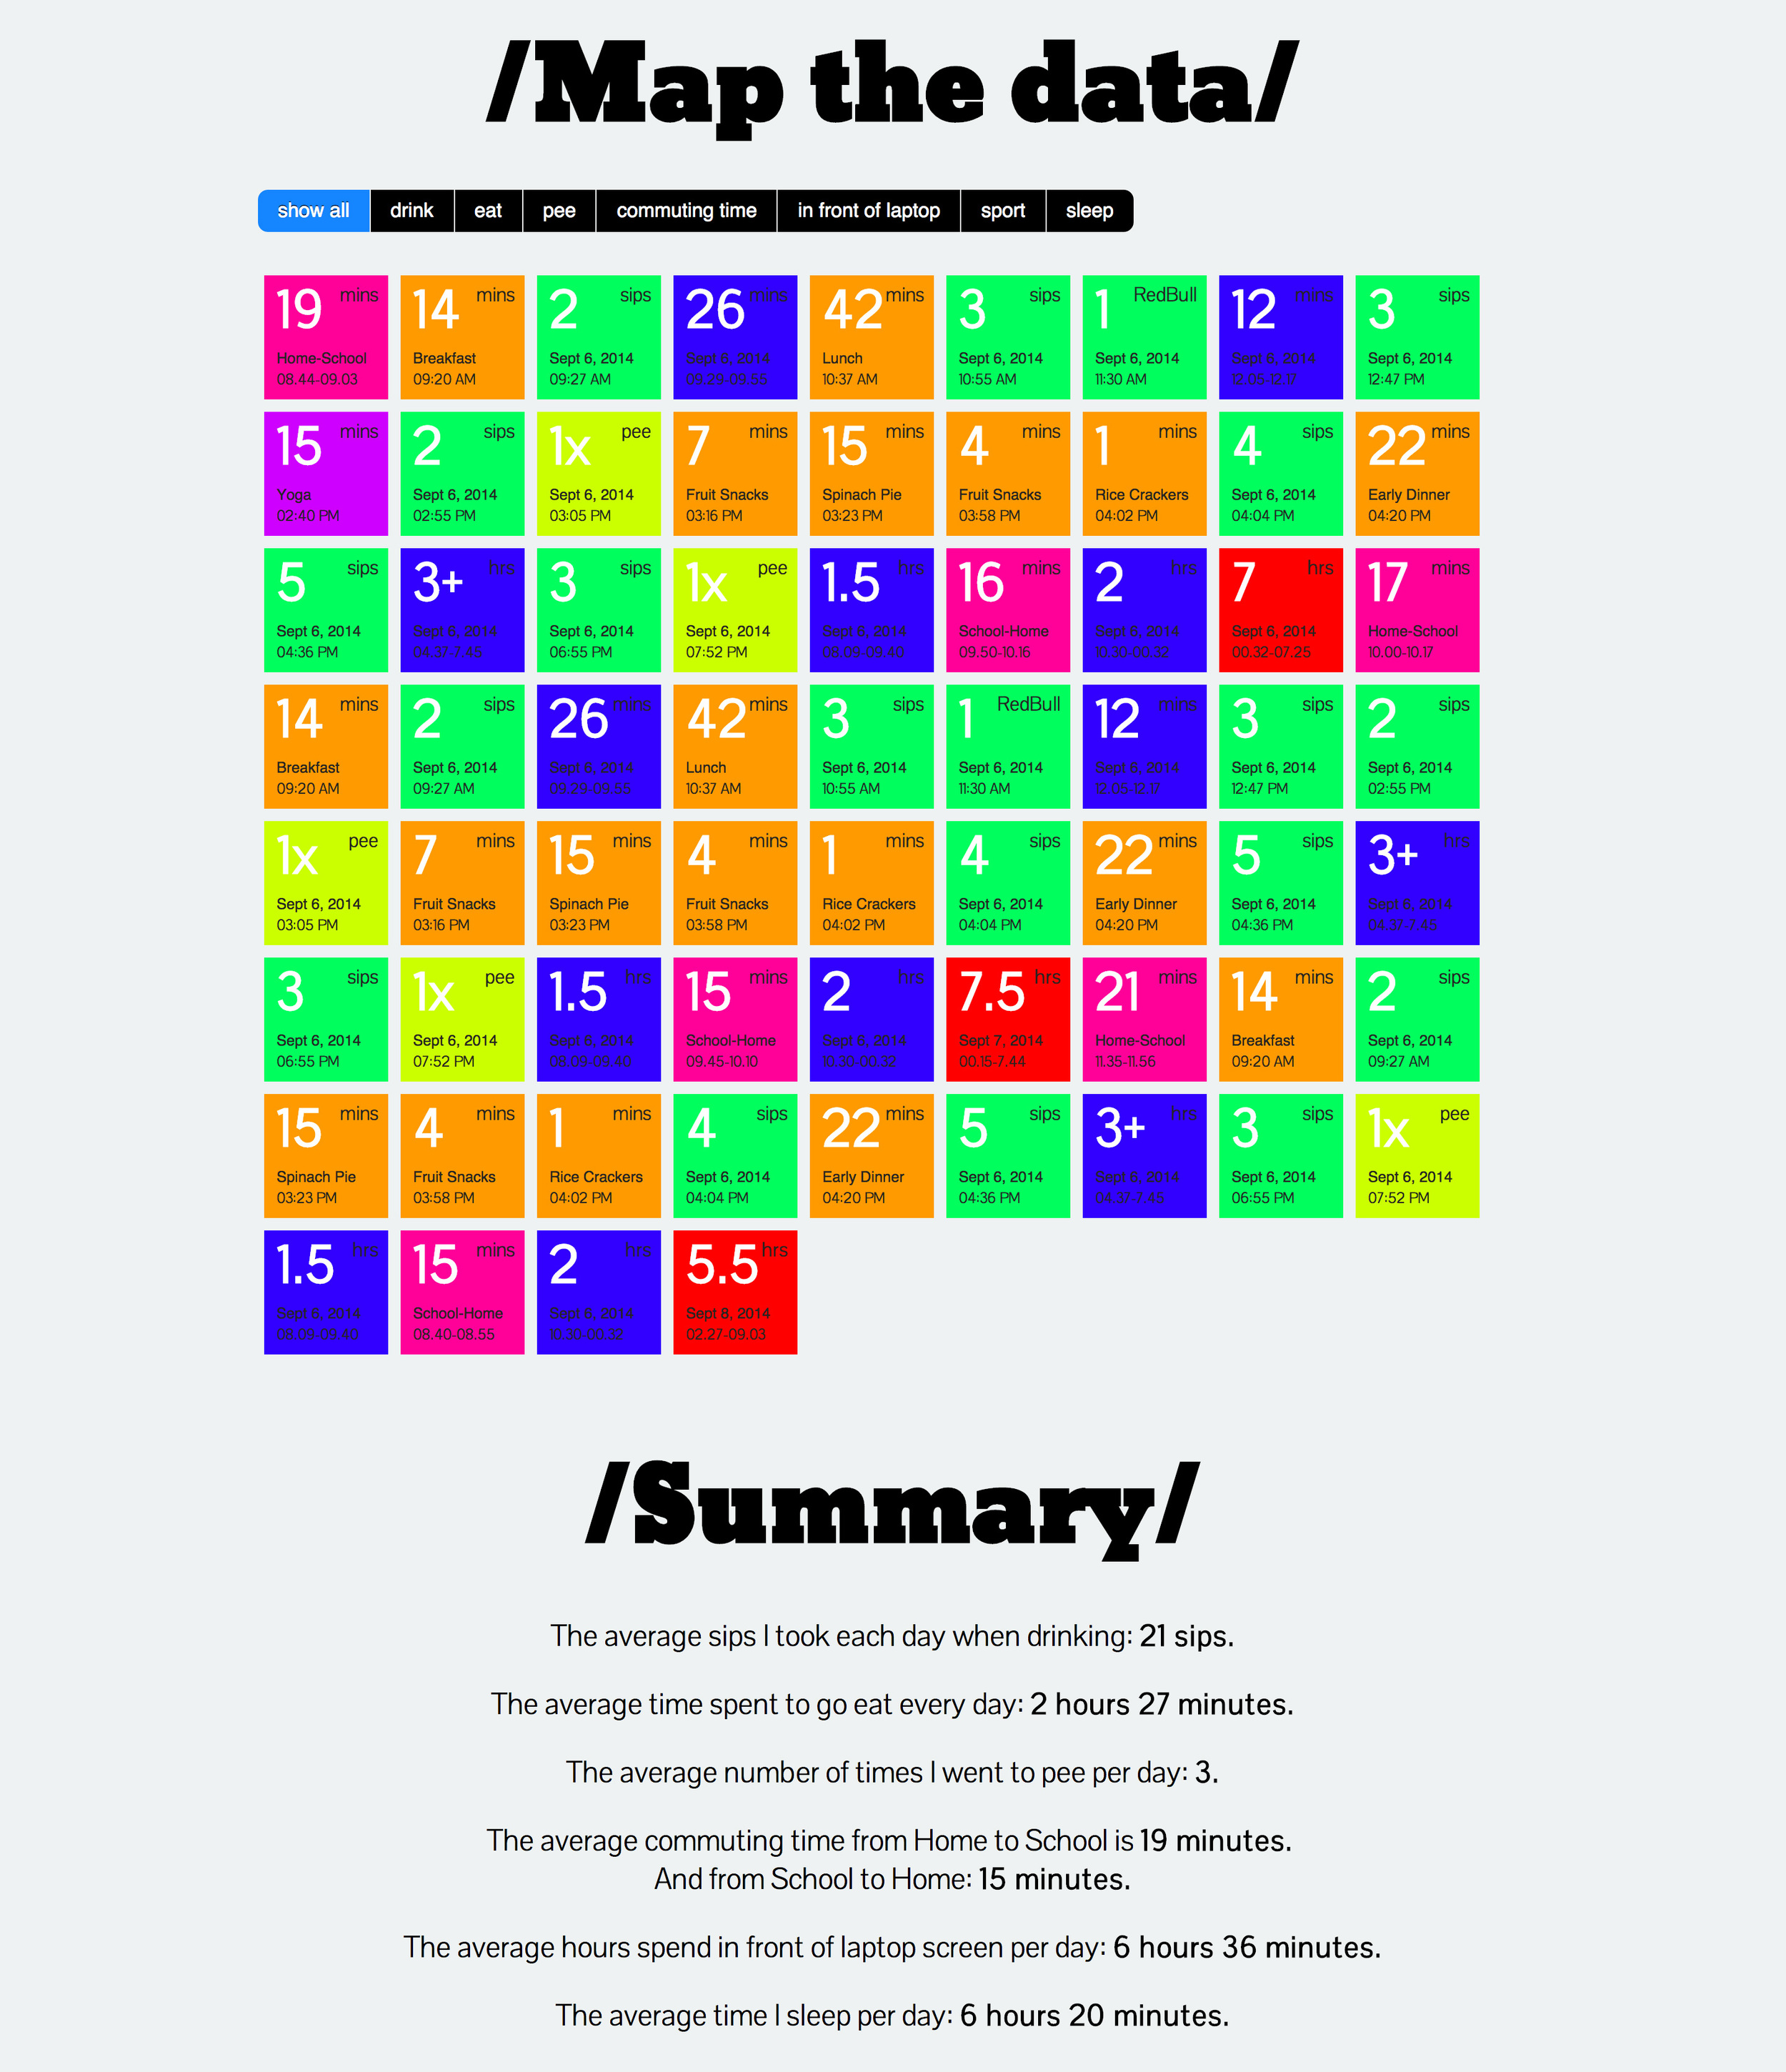
After creating the timeline, I mapped the data into some pretty basic categories and then create a summary profile. I found some interesting facts about myself, like how many hours I spent for grabbing something to eat/drink, the average commuting time between home and school, etc. This was a great exercise and I kinda enjoy doing the whole process.
Cheers!